Qlik Sense dashboard
Article: The data visualisers
10/2021 - Company data is a real treasure trove: DB Real Estate uses Qlik Sense to analyse and visualise data on interactive dashboards, thereby creating added value for all employees.
When employees read, analyse and use company data correctly, they are able to generate added value from the insights gained. Data is also a real treasure trove for DB Real Estate. "We want to use digital technology for our reporting needs and become a data-driven company," says Konstatin Wächter, IT Program Manager at DB Real Estate. To leverage and better utilise its own treasure trove of data, DB Systel joined forces with DB Real Estate to develop a centralised, modern and interactive Qlik Sense dashboard platform. "The goal here is to gain considerably faster insights and to standardise the calculation logic and manner in which data is used," explains Konstantin Wächter. By doing so, data will be able to provide informed answers to key questions in the future.
"We want to use digital technology for our reporting needs and become a data-driven company."

"We require a holistic approach to property management. For example, checks are conducted to ascertain compliance with the relevant regulations," says Konstantin Wächter. This ranges from fire protection inspections and regular checks through to optimum utilisation of each building. To ensure better leverage, each property's existing resources must be analysed from a utilisation perspective, for example. "We want to make better use of each property. However, to do that, we require information about building capacity utilisation, the number of people present at any given time and how many meeting rooms are needed," says Konstantin Wächter. "Answers to these questions must be founded on solid data, not just a gut feeling."
"Data-driven decisions are becoming the basis for new business processes."

"Data-driven decisions are becoming the basis for new business processes," agrees Ulf Nürnberger, Product Owner within the Data Vision unit at DB Systel. However, this is virtually impossible with conventional digital tools. Programs such as PowerPoint or Excel have limited capabilities. They can be used to display data in charts but are unable to determine the relationship between individual values. Qlik Sense, the Business Intelligence software, can be used to record, visualise and correlate KPIs, thereby making it possible to work interactively with data as well as evaluate and establish relationships with other values in order to gain fast and efficient insights.
Business Intelligence (BI) Software
BI software is not just a program but rather a collection of tools, applications and methods. For example, it can be used to collect company data from internal systems and external sources, prepare this data for analysis and, in a final step, create detailed reports, dashboards and data visualisations.
The benefits to this solution are manifold: Data is prepared for analysis and subsequently visualised using intuitive tools and simple self-service data visualisations. Users utilise interactive dashboards to evaluate data and gain insights, while open interfaces and comprehensive developer tools are used to integrate analytics functions, design custom analytics apps, and create new visualizations as required. This software can be used on a desktop, tablet or smartphone. Moreover, reports are provided in popular formats.
Using a standardised interface to gain insights
These dashboards no longer have anything in common with their static predecessors; all components are interactive. "In the past, everyone in a department created their own Excel spreadsheet," says Johanna Rudolf from the Platform Operations team at DB Systel. "However, all it took was for one person to accidentally sort a column incorrectly and suddenly the figures were completely different. This no longer happens with a standardised interface because everyone is working with the same tool, the same data, and the same functionalities."
"By looking at data relationships and dependencies from a new perspective, we are creating a new understanding of our data and how we can work with it. Essentially, we're learning to deal with data in a completely new way."

Qlik Sense offers DB Real Estate a wide range of user-defined applications and dashboards. Each application, together with its dashboards, deals with one topic. At DB Real Estate, documenting and managing compliance with fire safety regulations is one use case. The dashboard displays the checks, the number of scheduled inspections per property as well as information about any delays. Within the dashboard, information can be selected and filtered, for example, by customer and region, right down to the individual property. Data graphics can also be prepared. "This visualisation helps us to better perceive complex issues," explains Johanna Rudolf.
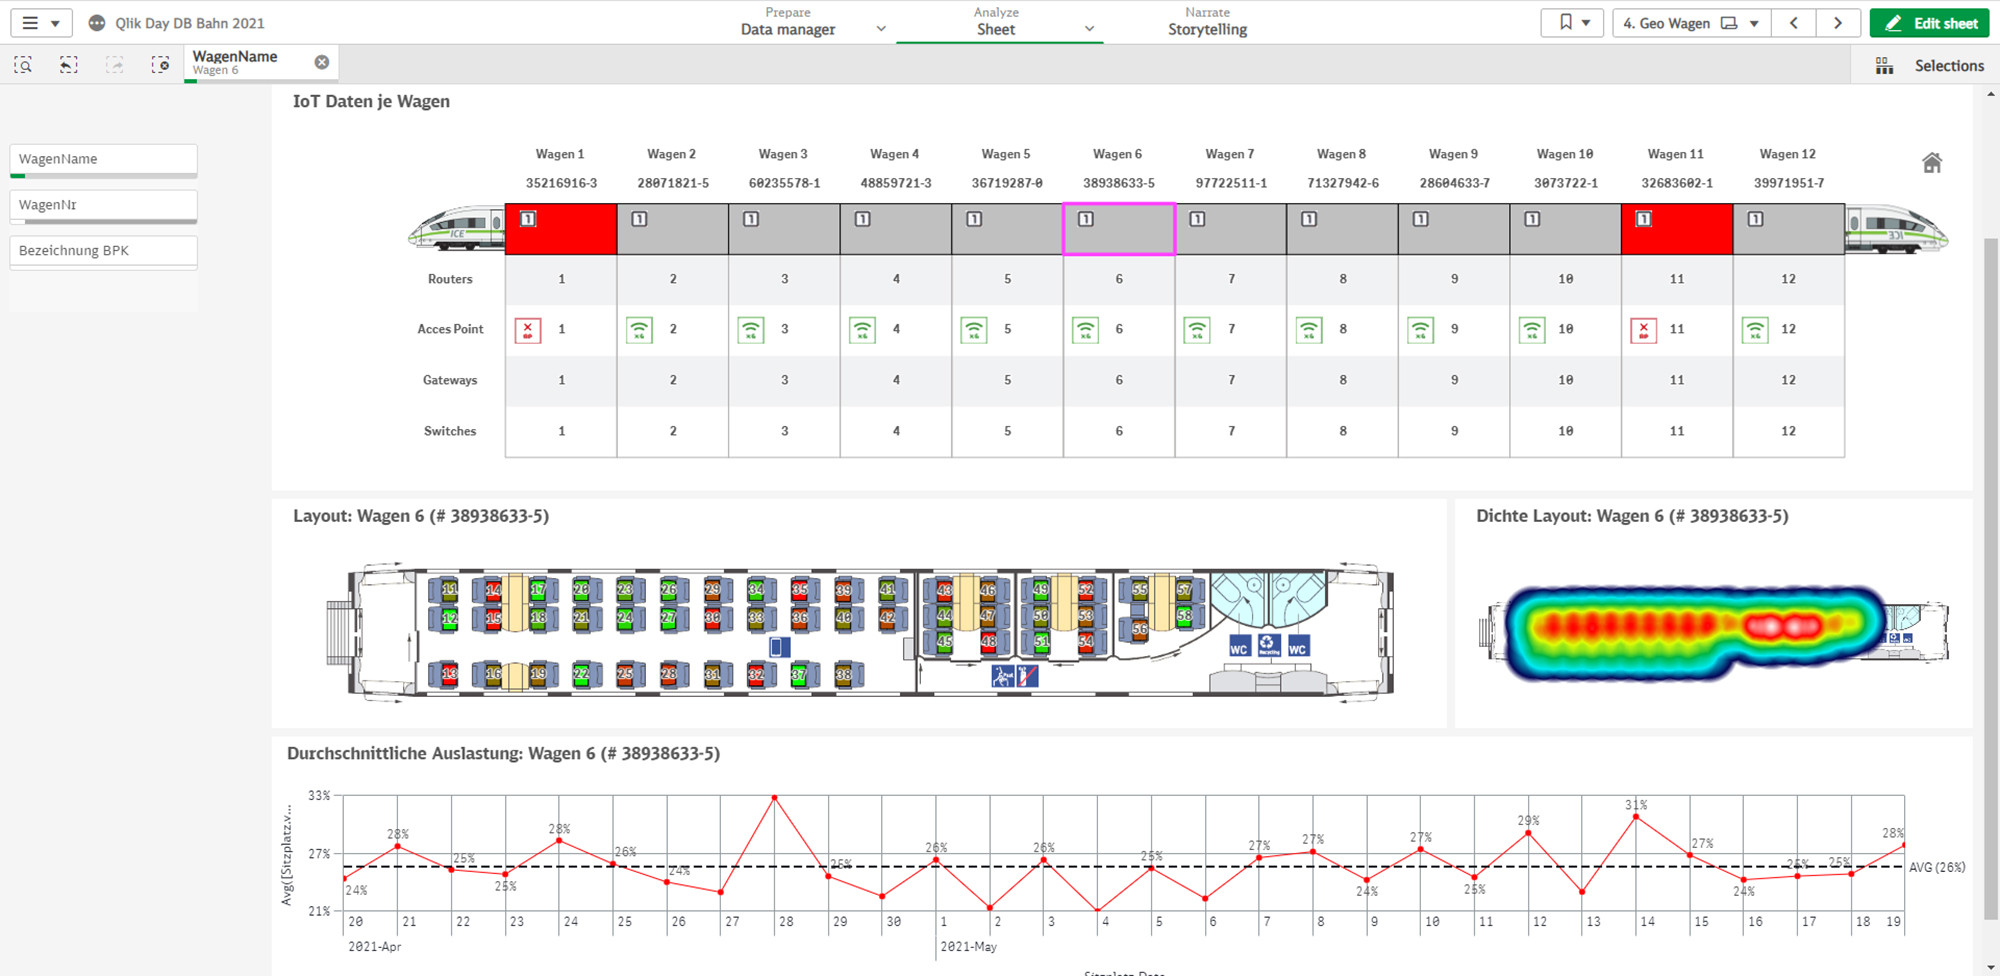
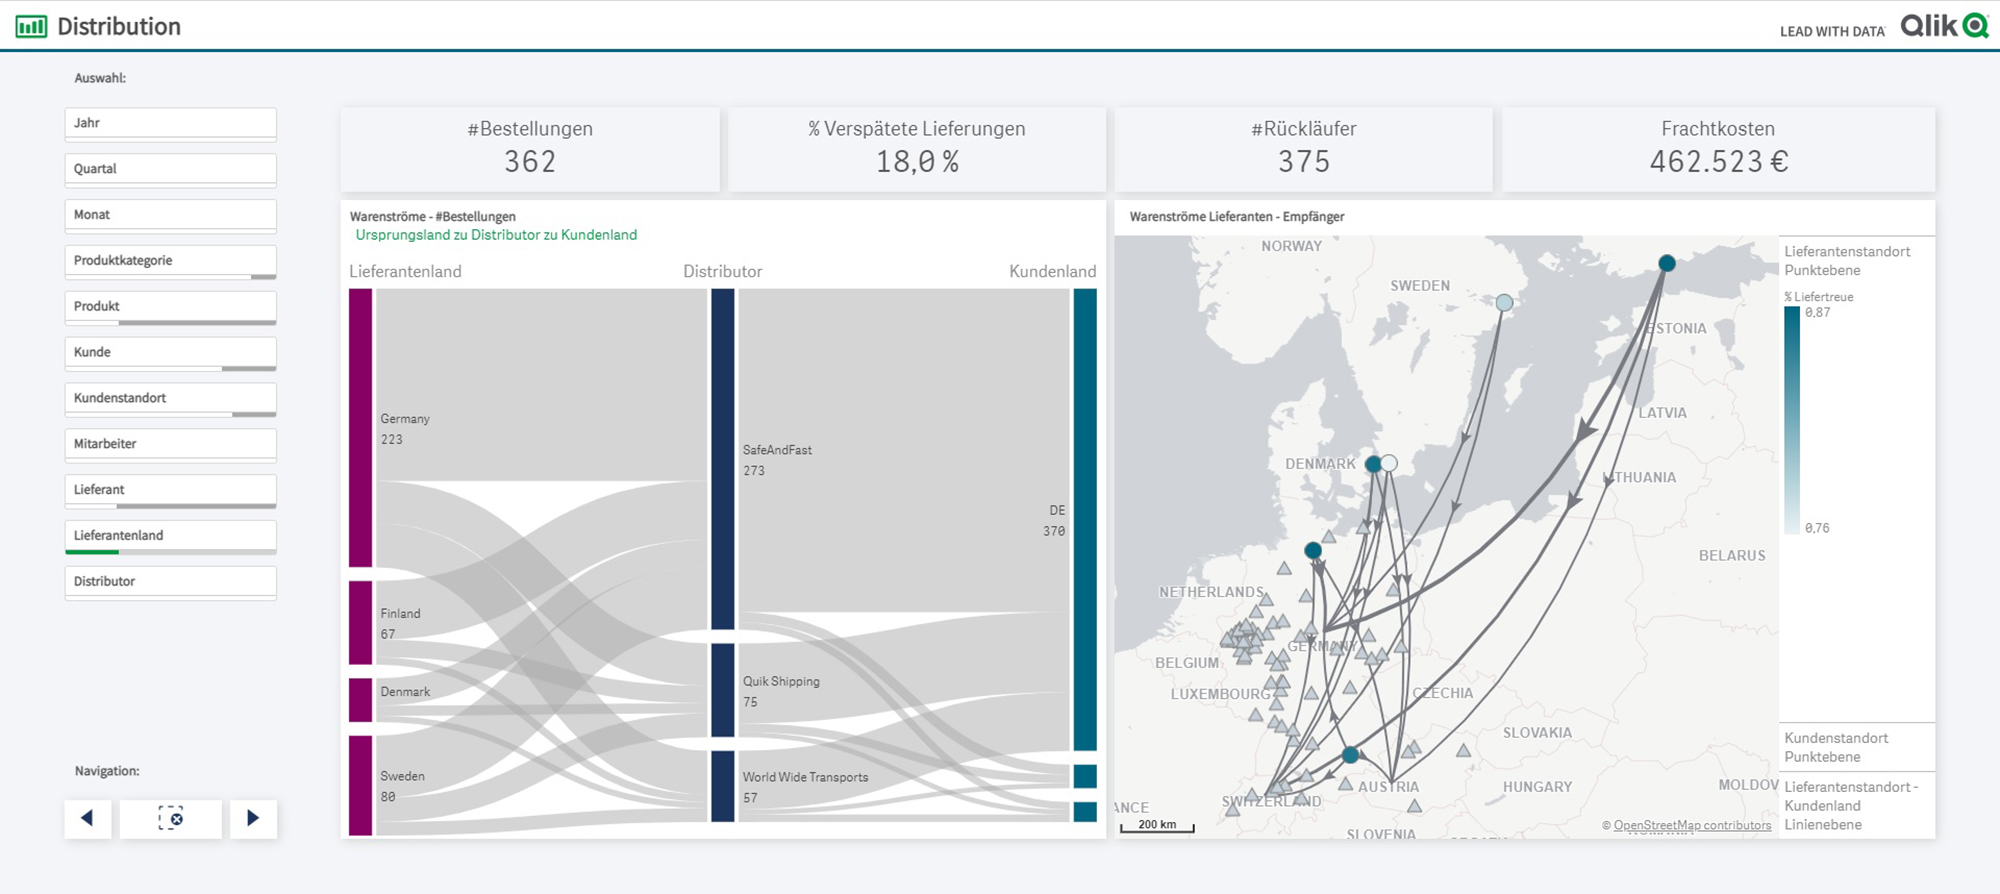
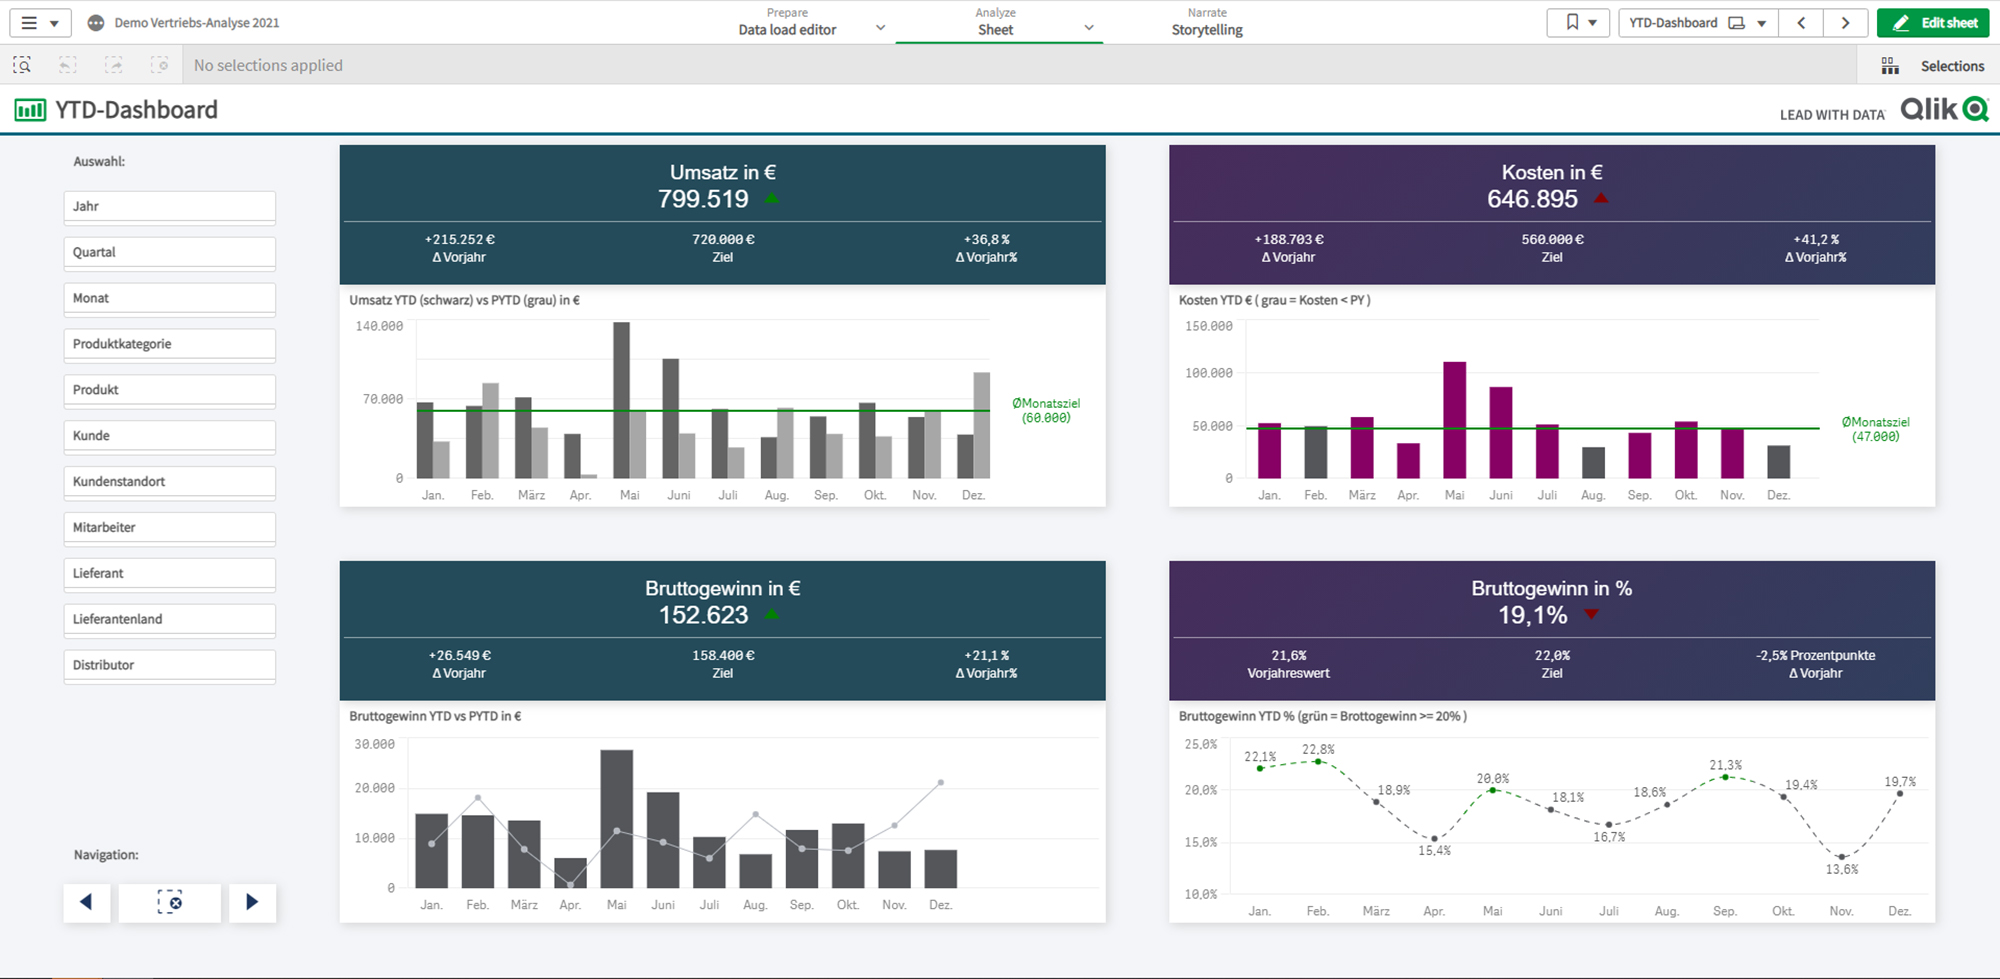
Sample dashboards for wagon capacity utilisation, the flow of goods, and revenue and cost trends
New way of dealing with data
If there are any irregularities, users can drill down to the details and investigate the root cause. Above all, the manual effort for employees is reduced considerably: For each data view, only an initial dashboard needs to be created, either by the department itself or a partner. The data is then updated automatically. "By looking at data relationships and dependencies from a new perspective, we are creating a new understanding of our data and how we can work with it," explains Johanna Rudolf. "Essentially, we're learning to deal with data in a completely new way."
Qlik Sense will make DB Real Estate less dependent on service providers. "We can run it ourselves without needing to have any comprehensive development expertise," says Konstantin Wächter. The dashboards enable every employee to understand data and visualise key performance indicators. The knowledge that forms the basis for insights and decisions is then shared throughout the entire company. Furthermore, employees themselves feel more competent when dealing with data. The first dashboards are now available at DB Real Estate and are already being used productively. The goal is to implement full analysis via Qlik in 2022 and replace all relevant reports. "At the same time, we will use enablement measures to improve each employee's ability to competently deal with data, tools and processes themselves," explains Ulf Nürnberger. "Gradually, we will be needed less and less, which is a good thing. For me, this is a real success story – a blueprint that we are also trying to establish in other companies within the DB Group."
It is also proof of the good cooperation and trust that has existed between DB Systel and DB Real Estate since the very start of the project and continues to grow.


 Go
Go